You may have heard the old saying, “Many make decisions by guessing or using their gut. They will be either very lucky or very wrong.” Because of these wise words, educators have worked diligently over the last decade to learn how to obtain, gather, compile, view, analyze and use data to avoid leaving student success to being “very lucky” or “very wrong.”
 Fast forward to today, nobody could have predicted the vast amount of data available daily to teachers or foresee schools that try to use data to fix “every” issue. Unfortunately, this abundance of data can be overwhelming, and teachers can often feel exhausted when it comes to data use and practice in schools. That said, the ability to analyze data and collaboratively engage in data-driven decision-making is critical to MTSS (Multi-Tiered System of Supports) processes, as they promote a culture of instruction catered to supporting students’ needs. This process takes time and intentionality, but promoting these processes will significantly impact student success.
1. Check To Make Sure You’re Using the Right Data
As discussed above, it can be overwhelming to consider all the student data available for teachers. So part of this process is knowing what data is most beneficial to use when evaluating student growth and at what level of intervention (Little, 2016).
MTSS is a system designed to support ALL students, but every piece of student data isn't necessary to provide effective support for all students. Teachers can use different parts of data to evaluate student growth depending on each student's instructional needs.
Starting at the broadest level, teachers should analyze the impact of teaching and learning for each student. A differentiated approach to core instruction (also known as Tier 1) is required within the MTSS framework, and ALL students receive Tier 1 instruction. Even if some students need additional support, they will still receive the day-to-day instruction representing the core curriculum.
Universal screening data (among other sources) provide much information that helps identify if students require additional support with academic, social-emotional learning (SEL) needs or behavior. As students are identified as needing support beyond core instruction at either the Tier 2 (strategic) or Tier 3 (intensive) levels, additional data sources should be used frequently to evaluate the impact of instruction and intervention on student growth.
The tables below outline what data can be used for this process within an MTSS framework, which students should be monitored at a given data level, and how often this data should be collected.
Types of Data Used in MTSS
|
Assessment Name |
What |
Who |
When |
|
Standardized assessment used to identify students’ areas of strength and need, offer a snapshot of progress over time |
All students |
3x per year (Beginning, Middle, End of the year) |
|
|
Diagnostic Assessment |
Assessment tools used to identify a student’s specific skills and knowledge |
Students in need of Tier 2 and Tier 3 support |
Follows universal screener after scores have been tiered, as needed if no progress is shown with intervention plans |
|
Standardized assessments used to assess a student’s progress towards a SMART goal, and determine the effectiveness of support provided |
Students in need of Tier 2 and Tier 3 support |
Weekly/Bi-weekly* *Dependent on interventions and student’s need |
|
|
Intervention-Embedded Assessments |
Progress monitor tools embedded into an intervention program. Only assesses a student’s progress in the intervention, not towards a SMART goal (Not a progress monitor) |
Students in need of Tier 2 and Tier 3 support |
Dependent on an intervention program |
|
Summative Assessments |
Assessments used to measure a student’s standards proficiency |
All students |
End of unit/year |
|
Formative Assessments |
Periodic “check-in” assessments, such as “pop quizzes” or “exit tickets'' used to guide Tier 1 instruction and measure students’ understanding of standards. Determines if instruction is effective or needs to be adjusted during instructional period |
All students |
Ongoing throughout instructional period |
Specific Data Used in MTSS
|
Tier 1: Differentiated Core Instruction |
Tier 2: Strategic Support |
Tier 3: Intensive Support |
|
|
Academic |
Universal screeners and or benchmark assessments (BOY, MOY, EOY), Curriculum-based assessments (aligned to curriculum pacing guides), quarterly grades |
All of Tier 1 data + Biweekly progress monitoring related to small group intervention goals |
All of Tier 1 and 2 data + Weekly progress monitoring related to one-on-one intervention goals |
|
Social-Emotional Learning |
SEL Screening assessments (BOY, MOY, EOY) |
All of Tier 1 data + Biweekly progress monitoring related to small group intervention goals |
All of Tier 1 and 2 data + Weekly progress monitoring related to one-on-one intervention goals |
|
Behavior |
School-based behavior tracking |
All of Tier 1 data + Biweekly progress monitoring related to small group intervention goals |
All of Tier 1 and 2 data + Weekly progress monitoring related to one-on-one intervention goals |
|
Other (data that can be used for Academic, SEL, and Behavior decision-making based on needs) |
Attendance, teacher observations (can include aspects of Academic, SEL, and Behavior) |
All of Tier 1 data + Teacher observations based on small group intervention goals |
All of Tier 1 and 2 data + Teacher observations based on one-on-one intervention goals, parent feedback, observations from other school staff who interact and work with student |
2. Check To Make Sure You’re Analyzing MTSS Data Correctly
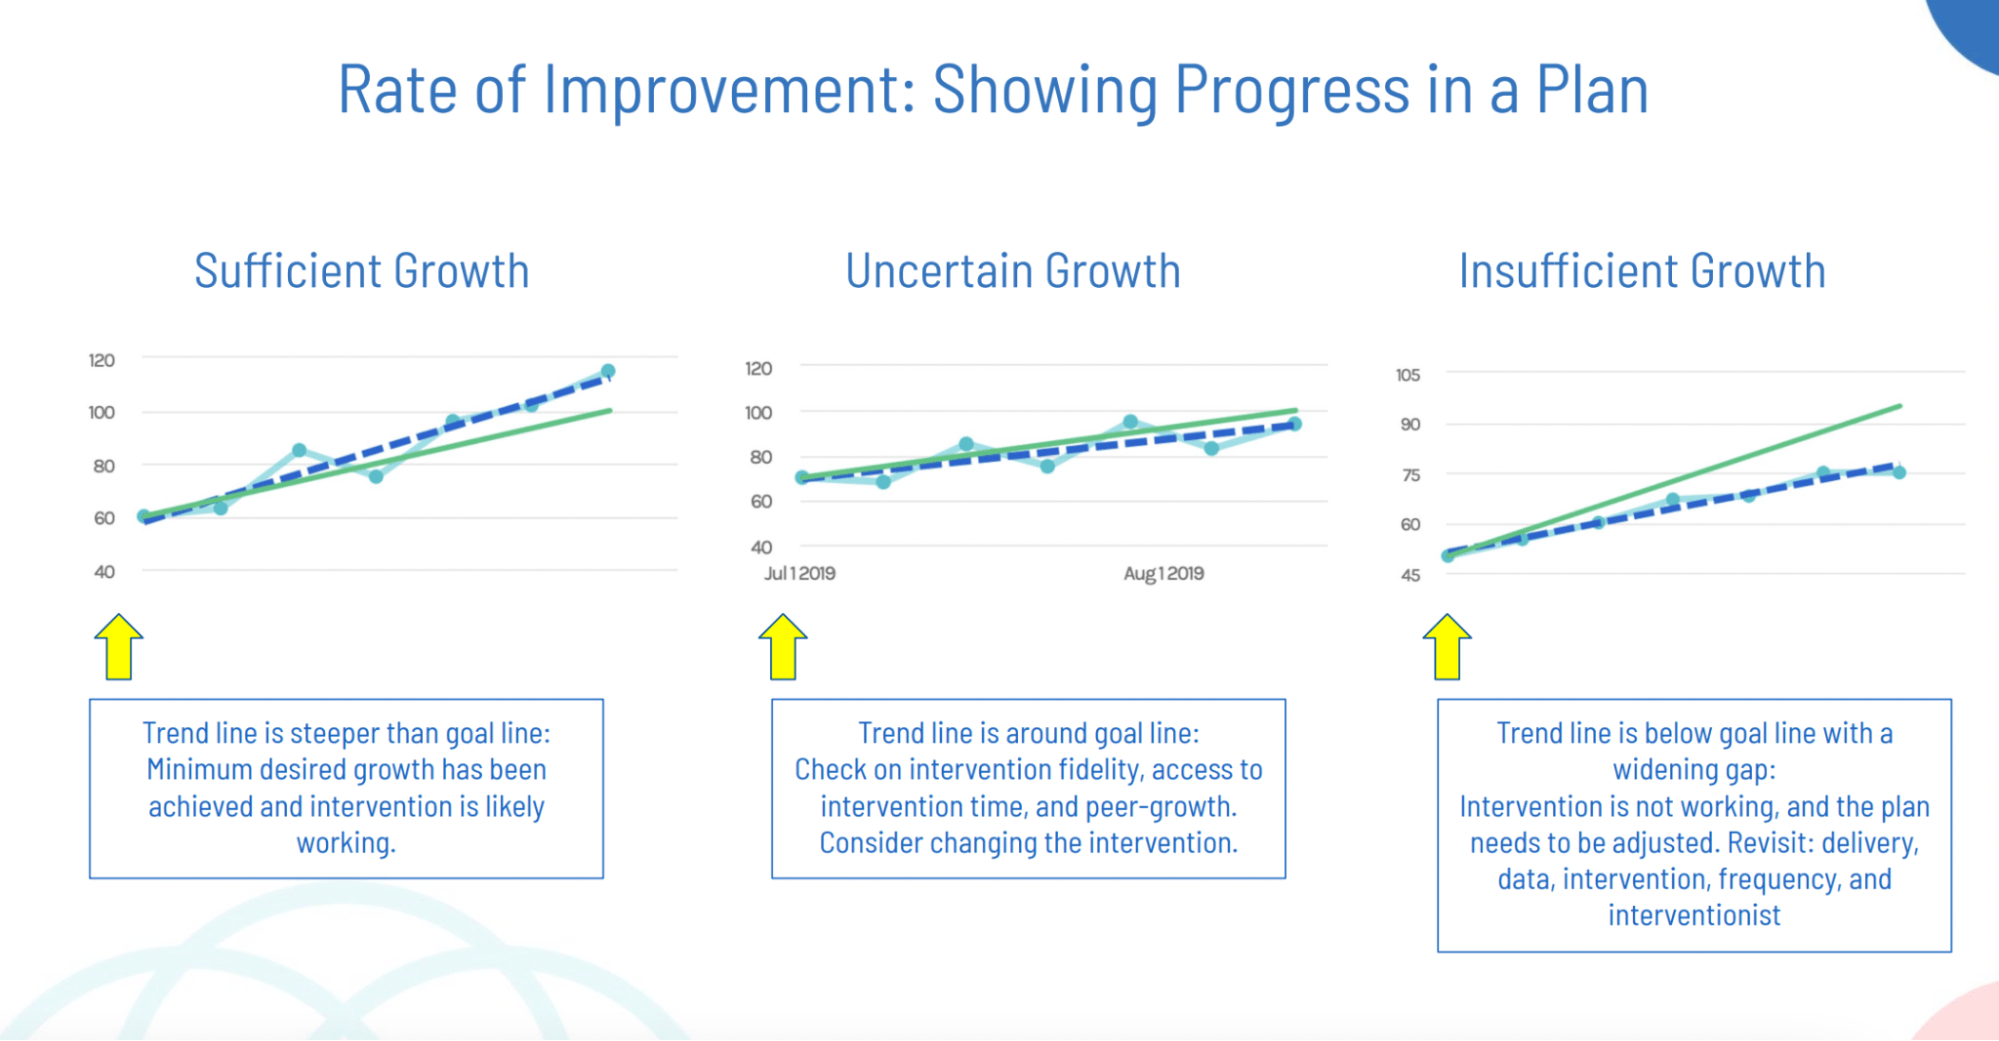
Using the data from the charts above allows educators to determine a student's success with given support and determine the student's Rate of Improvement (ROI) to facilitate better decision-making about the next instructional steps. This ROI analysis shows whether a student is making sufficient growth towards a specific goal and identify if a student's growth is either uncertain or insufficient towards the given goal.
The image below demonstrates what student data could look like if a student has made sufficient growth, uncertain growth, or insufficient growth towards a goal. To establish the ROI, it is essential to remember that multiple data points must be collected over a set period (as suggested in the charts above) to create a trend line that shows student growth.

3. Utilize Data-Based Decision Making in MTSS
Collaborative, data-based decision-making, and reflections are tenants of MTSS processes and are based on data collected. This collaboration takes place in three ways:
- The School Leadership Meeting: This meets three times a year and discusses campus-wide trends found;
- The Grade/Content Team Community Meeting: Monthly meetings are held during a dedicated grade-level team meeting to discuss student’s areas of strength and need, review student’s ROI, and determine instructional next steps for students receiving learning supports or targeted interventions at Tier 2 or Tier 3 levels; and
- The Individual Student Support Meeting: During this meeting, individualized deep-dive problem-solving for students not making sufficient progress when supported by the Grade/Content Team Community Meeting.
|
LEARN MORE ➡️ MTSS Meeting Guides Download these quick guides to help you conduct effective meetings, optimize your use of time, and exit your MTSS meetings with clear action plans! |
4. Fidelity in Practice is Important
A critical aspect of understanding and analyzing the data is evaluating whether the data is accurately portraying whether or not the curriculum, learning supports, interventions, assessments, and observations are carried out with fidelity. Fidelity, in this context, refers to “How closely prescribed procedures are followed and, in the context of schools, the degree to which educators implement programs, assessments, and implementation plans the way they were intended” (National Center for Intensive Intervention, N.D.).
The National Center for Intensive Intervention suggests many different questions regarding the elements of fidelity that can be considered when reflecting upon whether or not the student’s ROI is accurate:
- Did we adhere to a specific plan? How well do we stick to the prescribed procedures regarding implementing curriculum, assessment, learning supports, or interventions?
- What was the student’s exposure/duration with each learning support or intervention? Did any factors prevent the student from receiving the support as intended?
- What was the quality of delivery? Were core content, assessment, learning supports, and interventions delivered with quality and best practices?
- What was the student’s role when receiving content/support/intervention? How engaged, attentive, and involved are the students in this intervention or activity?
Additional points for reflection:
- What is the proven research base for the curriculum, learning support, or intervention? Is there a clear understanding of how to use the curriculum, learning support, or intervention, why to use it, how to use it in alignment with the evidence, and what the evidence is to provide the most efficient and effective experience for each student?
- Did attendance play a role in the student’s performance? Was either the student and educator in attendance for each delivery or were there lapses that could impact student performance?
- Was the content, learning support, or intervention easy to access, or did it require a lot of pre-work? Did the materials need to implement the curriculum/learning support/intervention materials need to be purchased or created to implement the support to support efficiently?
➡️ Check out this MTSS Implementation Fidelity Reference Guide
These elements of fidelity for reflection should guide discussions during collaborative meetings and can also help to determine if the collected data about a given student is providing the most accurate picture of their performance and skill level (depending on answers to the questions above). This process of collaboratively using specific data with fidelity to make instructional decisions can be considered student-focused decision-making and is embedded within MTSS. Student-focused decision-making allows teachers to rely not on "luck" or their "gut" but on reliable evidence collected to take the next instructional steps.
|
MAIN TAKEAWAYS FROM THIS ARTICLE:
|
|
Related resources you may be interested in: |
Learn more about utilizing MTSS data in this on-demand webinar: Best Practices on Interpreting Assessment Data
Citations
Collaborative for Academic, Social, and Emotional Learning. (2022, March 11). Fundamentals of SEL. CASEL. Retrieved June 2, 2022, from https://casel.org/fundamentals-of-sel/
Gummer, E.S. & Mandinach, E.B. (2015). Building a conceptual framework for data literacy. Teachers College Record, 117 (4), 1-12.
Little, M. (2016, September). Why is data and data-based decision making such a critical part of instruction and intervention? National Center on Intensive Intervention. other, National Center on Intensive Intervention at the American Institute for Research. Retrieved June 1, 2022, from https://intensiveintervention.org/resource/why-data-and-data-based-decision-making-such-critical-part-instruction-and-intervention.
National Center on Intensive Intervention at the American Institute for Research. (n.d.). Considerations for effective implementation: 5 Elements of Fidelity. Considerations for Effective Implementation: 5 Elements of Fidelity | NCII. Retrieved June 2, 2022, from https://intensiveintervention.org/resource/five-elements-fidelity
National Center for Intensive Intervention. (n.d.). Fidelity Tools. Fidelity Tools | NCII. Retrieved June 15, 2022, from https://intensiveintervention.org/implementation-intervention/fidelity#:~:text=Fidelity%20refers%20to%20how%20closely,the%20way%20they%20were%20intended.
![[Guest Author] Kismet Lantos-Swett-avatar](https://www.branchingminds.com/hs-fs/hubfs/Team/Round%20cropped%20headshots/Screen%20Shot%202022-05-23%20at%206.32.48%20PM.png?width=82&height=82&name=Screen%20Shot%202022-05-23%20at%206.32.48%20PM.png)
About the author
[Guest Author] Kismet Lantos-Swett
Kismet Lantos-Swett is a Branching Minds Educational Consultant based in Chicago, IL. Kismet has served students, educators, and leaders through various roles throughout her career including as a classroom teacher, learning specialist, literacy interventionist, and as a Leadership for Educational Equity Fellow in the Rhode Island Department of Education. She is passionate about helping teachers feel empowered to have a strengths-based mindset in supporting their students so that students can grow and find success in a safe, curious, and compassionate environment. Kismet has both a Masters of Education in education, policy and management from the Harvard Graduate School of Education and a Masters of Teaching in Elementary Education from Marian University.

Your MTSS Transformation Starts Here
Enhance your MTSS process. Book a Branching Minds demo today.


.png?width=716&height=522&name=Addressing%20Foundational%20Reading%20Skills%20in%20MTSS%20(preview).png)

.png?width=716&height=522&name=Understanding%20Literacy%20Basics%20(Preview).png)